Introduction
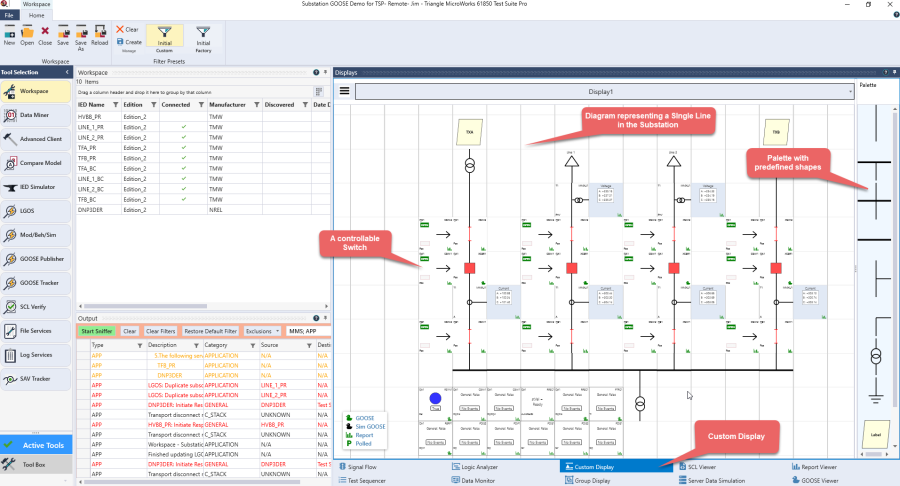
The Custom Display can be used to visualize and monitor the data in a Substation. Each Tile represents a Data Object. Customized Tiles have been designed for each type of Data Object. These Data Objects can be stacked on top of each other to create displays much like a Single Line diagram as shown below:
-
A predefined list of connectors and elements normally used in an electrical scheme is available in the palette on the right.
-
Data in the Custom Display is acquired via either GOOSE/Report/Polling.


